Note
Go to the end to download the full example code.
More complicated probes
This example demonstrates how to generate a more complicated probe with hybrid contacts shape and contact rotations within the contact_plane_axes attribute.
import numpy as np
import matplotlib.pyplot as plt

from probeinterface import Probe
from probeinterface.plotting import plot_probe
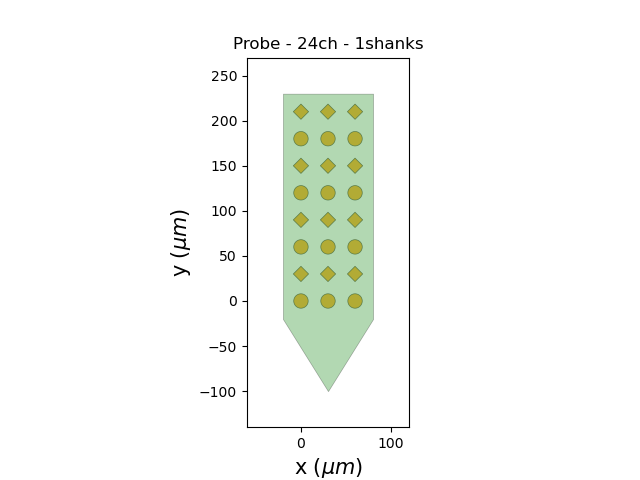
Let’s first set the positions of the contacts
n = 24
positions = np.zeros((n, 2))
for i in range(3):
    positions[i * 8: (i + 1) * 8, 0] = i * 30
    positions[i * 8: (i + 1) * 8, 1] = np.arange(0, 240, 30)
Electrode shapes can be arrays to handle hybrid shape contacts
shapes = np.array(['circle', 'square'] * 12)
shape_params = np.array([{'radius': 8}, {'width': 12}] * 12)
- The plane_axes argument handles the axis for each contact.
It can be used for contact-wise rotations.
plane_axes has a shape of (num_elec, 2, ndim)
plane_axes = [[[1 / np.sqrt(2), 1 / np.sqrt(2)], [-1 / np.sqrt(2), 1 / np.sqrt(2)]]] * n
plane_axes = np.array(plane_axes)
Create the probe
probe = Probe(ndim=2, si_units='um')
probe.set_contacts(positions=positions, plane_axes=plane_axes,
                     shapes=shapes, shape_params=shape_params)
probe.create_auto_shape()
plot_probe(probe)
(<matplotlib.collections.PolyCollection object at 0x7d7b04785ff0>, <matplotlib.collections.PolyCollection object at 0x7d7b06b02ad0>)
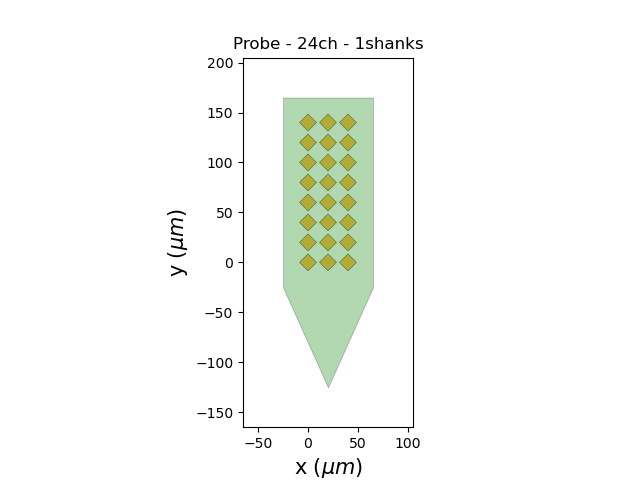
We can also use the rotate_contacts to make contact-wise rotations:
from probeinterface import generate_multi_columns_probe

probe = generate_multi_columns_probe(num_columns=3,
                                     num_contact_per_column=8, xpitch=20, ypitch=20,
                                     contact_shapes='square', contact_shape_params={'width': 12})
probe.rotate_contacts(45)
plot_probe(probe)
(<matplotlib.collections.PolyCollection object at 0x7d7b04724790>, <matplotlib.collections.PolyCollection object at 0x7d7b04727d90>)
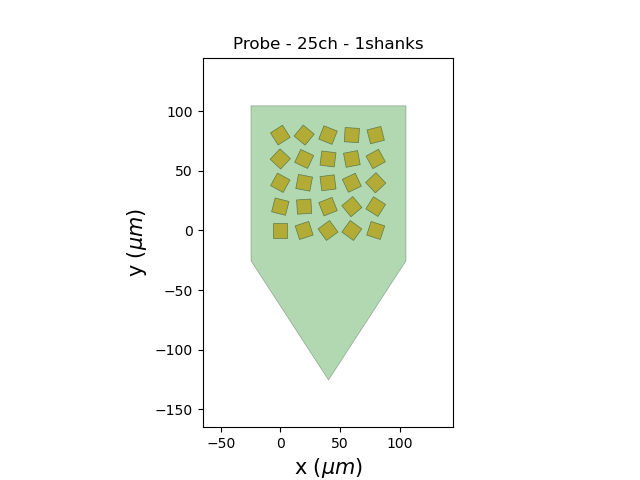
probe = generate_multi_columns_probe(num_columns=5,
                                     num_contact_per_column=5, xpitch=20, ypitch=20,
                                     contact_shapes='square', contact_shape_params={'width': 12})
thetas = np.arange(25) * 360 / 25
probe.rotate_contacts(thetas)
plot_probe(probe)

plt.show()
Total running time of the script: (0 minutes 0.213 seconds)