Note
Go to the end to download the full example code
More plotting examples
Here are some examples to showcase several plotting scenarios.
Import
import numpy as np
import matplotlib.pyplot as plt

from probeinterface import Probe, ProbeGroup
from probeinterface.plotting import plot_probe, plot_probe_group
from probeinterface import generate_multi_columns_probe, generate_linear_probe
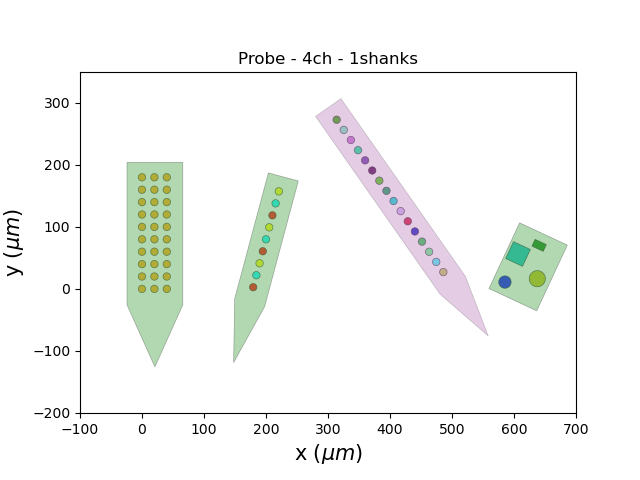
Some examples in 2d
fig, ax = plt.subplots()

probe0 = generate_multi_columns_probe()
plot_probe(probe0, ax=ax)

# give each probe a different color
probe1 = generate_linear_probe(num_elec=9)
probe1.rotate(theta=15)
probe1.move([200, 0])
plot_probe(probe1, ax=ax,
           contacts_colors=['red', 'cyan', 'yellow'] * 3)

# prepare yourself for carnival!
probe2 = generate_linear_probe()
probe2.rotate(theta=-35)
probe2.move([400, 0])
n = probe2.get_contact_count()
rand_colors = np.random.rand(n, 3)
plot_probe(probe2, ax=ax, contacts_colors=rand_colors,
           probe_shape_kwargs={'facecolor': 'purple', 'edgecolor': 'k', 'lw': 0.5, 'alpha': 0.2})

# and make some alien probes
probe3 = Probe()
positions = [[0, 0], [0, 50], [25, 77], [45, 27]]
shapes = ['circle', 'square', 'rect', 'circle']
params = [{'radius': 10}, {'width': 30}, {'width': 20, 'height': 12}, {'radius': 13}]
probe3.set_contacts(positions=positions, shapes=shapes,
                      shape_params=params)
probe3.create_auto_shape(probe_type='rect')
probe3.rotate(theta=25)
probe3.move([600, 0])
plot_probe(probe3, ax=ax, contacts_colors=['b', 'c', 'g', 'y'])

ax.set_xlim(-100, 700)
ax.set_ylim(-200, 350)

ax.set_aspect('equal')

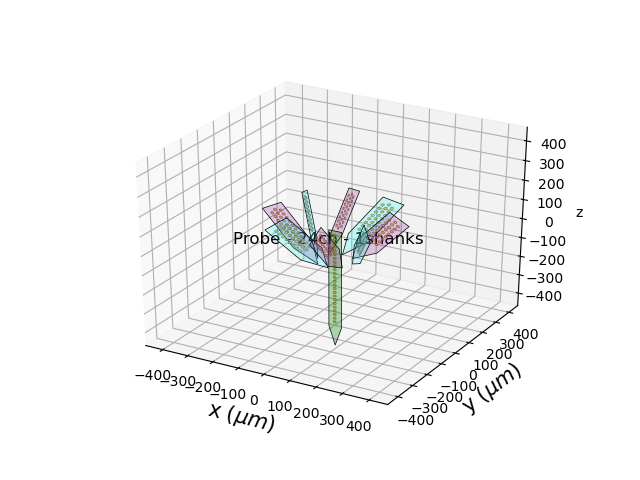
Some examples in 3d for the romantic who likes flowers…
fig = plt.figure()
ax = fig.add_subplot(1, 1, 1, projection='3d')

n = 8
for i in range(n):
    probe = generate_multi_columns_probe(num_columns=3,
                                         num_contact_per_column=[8, 9, 8],
                                         xpitch=20, ypitch=20,
                                         y_shift_per_column=[0, -10, 0]).to_3d()
    probe.rotate(theta=35, center=[0, 0, 0], axis=[0, 1, 0])
    probe.move([100, 50, 0])
    probe.rotate(theta=i * 360 / n, center=[0, 0, 0], axis=[0, 0, 1])
    plot_probe(probe, ax=ax,
               probe_shape_kwargs={'facecolor': ['purple', 'cyan'][i % 2], 'edgecolor': 'k', 'lw': 0.5, 'alpha': 0.2})

probe = generate_linear_probe(num_elec=24, ypitch=20).to_3d()

probe.move([0, 0, -450])
plot_probe(probe, ax=ax)

lims = -450, 450
ax.set_xlim(*lims)
ax.set_ylim(*lims)
ax.set_zlim(*lims)

plt.show()

Total running time of the script: (0 minutes 0.362 seconds)